Looking to measure your SEO with Google Analytics?
Then I’ve got 5 Google Analytics SEO dashboards for you. These give you useful data on your SEO traffic, content, and geographic/mobile visitors. Use the download links to import these directly to your Google Analytics account so you can collect data about your site. You may need to change some filters to do this, which I provided instructions where this is needed…
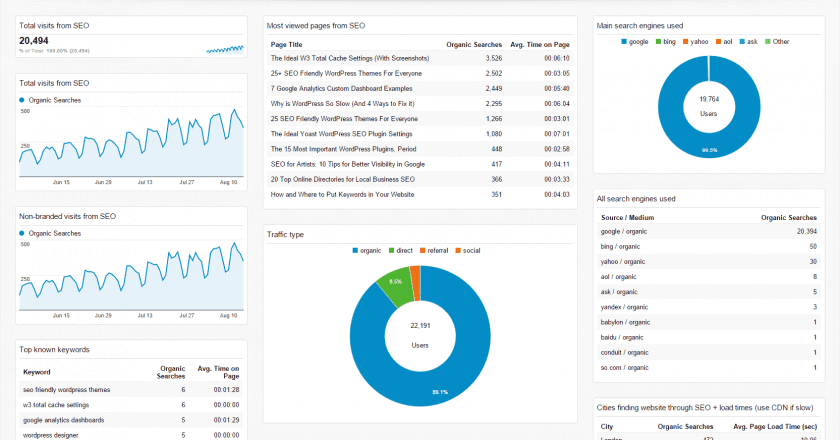
1. General SEO Dashboard
Get a glimpse of your overall SEO campaign.
Metrics:
- Total visits from SEO
- Non-branded visits from SEO (change filter to your brand name with variations)
- Top known keywords (same thing)
- Most viewed pages from SEO
- Traffic type
- Main search engines used
- All search engines used
- Cities finding website through SEO + load times (use a CDN if slow)
2. Content Performance Dashboard
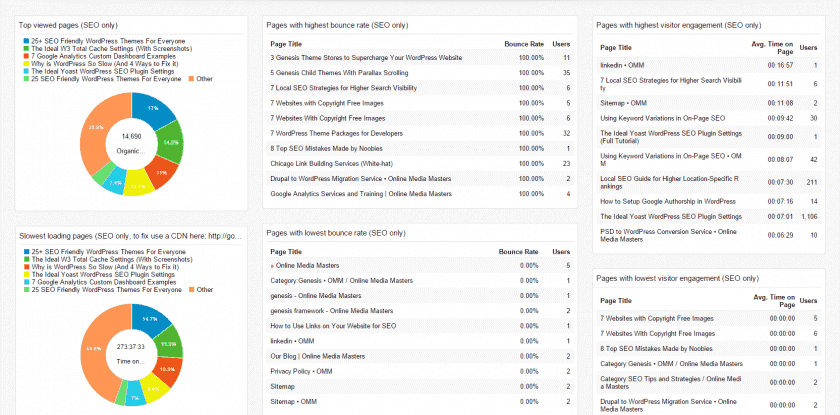
Good content is an SEO’s best friend. Learn which content is performing, and which is not.
Metrics:
- Top viewed pages (SEO only)
- Slowest loading pages
- Content with highest and lowest bounce rate
- Content with highest and lowest visitor engagement
3. Topic-Specific Dashboard
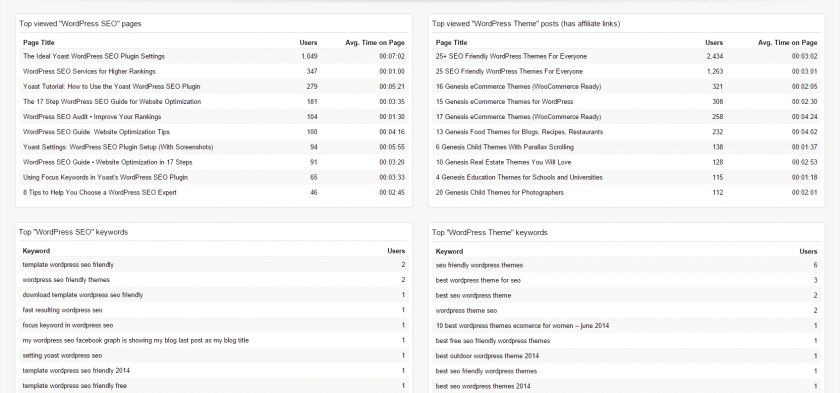
This dashboard needs some explanation but it is so useful. If you have a specific topic you want to segment (a product, service, blog topic, etc) and want see how it’s landing page(s) are performing, this SEO dashboard will help you do that.
For example, two main topics I write about (or offer) are WordPress SEO and WordPress Themes (I write about themes and use affiliate links to make a commission off purchases). The left side of this dashboard tells me about pages/posts on my site containing “WordPress SEO” and the right side is the same for “WordPress Themes.”
You can change this to whatever products/services/topics you want to measure. Just edit the filters to change the wording (click on the pen icon in each widget to do this).
Metrics:
- Top viewed pages related to any topic on your site (change words in filter)
- Top keywords related to any topic on your site (change words in filter)
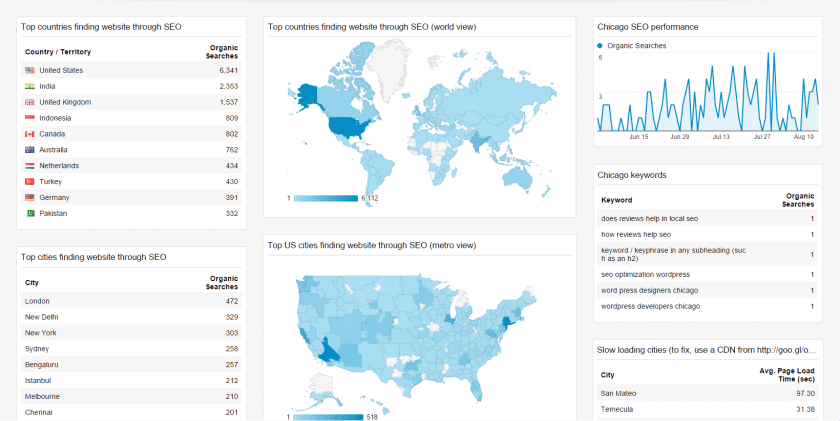
4. Geographic Analytics
Learn which cities and geographic areas are sending the most SEO traffic.
Metrics:
- Top countries finding website through SEO
- Top cities finding website through SEO
- Top US cities finding website through SEO (change to your country)
- Map views of areas finding your website through SEO
- Chicago SEO performance (change to any city)
- Chicago keywords (change to any city)
- Cities with slowest load times (to fix this, use MaxCDN’s content delivery network)
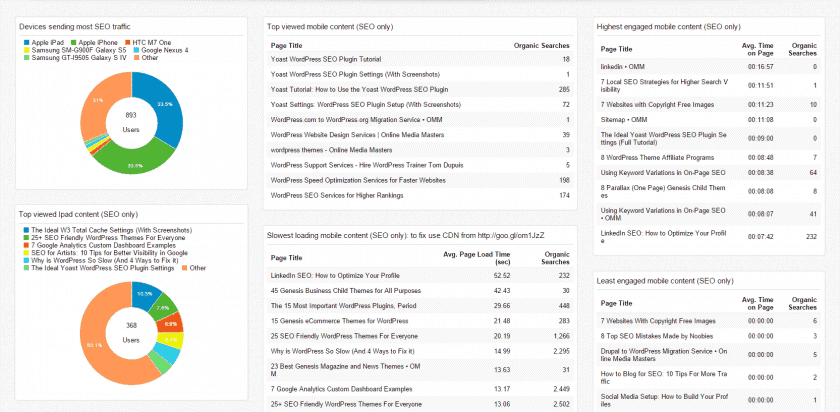
5. Mobile Analytics
Learn how mobile content is performing for SEO visitors. If your site is not responsive, the easiest way to fix this is to use a responsive theme. WordPress users can check out my list of SEO-Optimized (Responsive) themes which are built in the notorious Genesis Framework.
Metrics:
- Devices sending most SEO traffic
- Top viewed Ipad content (change filter if you want)
- Top mobile keywords (known, unbranded – change to your brand name)
- Top viewed mobile content (SEO only)
- Slowest loading mobile content (SEO only, use my CDN link in the widget to fix)
- Highest engaged mobile content (SEO only)
- Least engaged mobile content (SEO only)
